elasticsearch-http
The elasticsearch-http() destination driver is used to send messages to elasticsearch.
Important Information
The syslog-ng OSE elasticsearch-http() driver is compatible withElasticsearch 7.X and newer. To be able to use it, you need HTTP and JSON support enabled in syslog-ng.
Status
| Architecture | Status |
|---|---|
| x86 | Works |
| ARM | Works |
Testing
Elasticsearch Setup
To test this driver, we need to set up Elasticsearch first. You can use Homebrew to brew install Elasticsearch and the rest of the ELK stack. A new official Homebrew tap developed by Elastic makes this procedure super easy.
To be able to successfully test this driver, we need to install Elasticsearch and Kibana. Where Elasticsearch is the framework and Kibana is a user interface that lets you visualize your Elasticsearch data. To install all these, we need to do the following:
$ brew tap elastic/tap
$ brew install elastic/tap/elasticsearch-full
$ brew install elastic/tap/kibana-full
To run Elasticsearch in the background, use:
$ brew services start elastic/tap/elasticsearch-full
Or, if you don’t want/need a background service you can just run:
$ elasticsearch
Once we do this, we can run our syslog-ng OSE instance that is sending logs to an Elasticsearch database.
Configuration File Used
@version: 3.33
@include "scl.conf"

options {
    stats-freq(10);
    time-reopen(10);
};

source custom
{
    example-msg-generator(
        num(3)
        freq(5)
        template("Test Message to Elasticsearch")
    );
};

destination console{
    file(/dev/stdout);
};

destination d_elasticsearch_http {
    elasticsearch-http(
        index("test-syslog-ng")
        type("")
        url("http://localhost:9200/_bulk")
        template("$(format-json --scope rfc5424 --scope dot-nv-pairs
        --rekey .* --shift 1 --scope nv-pairs
        --exclude DATE --key ISODATE @timestamp=${ISODATE})")
    );
};

log {
    source(custom);
    destination(console);
    destination(d_elasticsearch_http);
};
How To View Data
Now, we have sent data on the default address with the index - “test-syslog-ng”. To see this, we need to use Kibana.
NOTE
You can also simply run:
curl -X GET 'http://localhost:9200/test-syslog/_search'
to check whether the messages have been sent.
To run Kibana in the background, use:
$ brew services start elastic/tap/kibana-full
Or, if you don’t want/need a background service you can just run:
$ kibana
To access Kibana, open your browser at:
$ http://localhost:5601
You should see Kibana’s welcome screen. We need to add the index that we are concerned with first. To do so, navigate to:
_Menu -> Management -> Stack Management -> Kibana -> Index Patterns
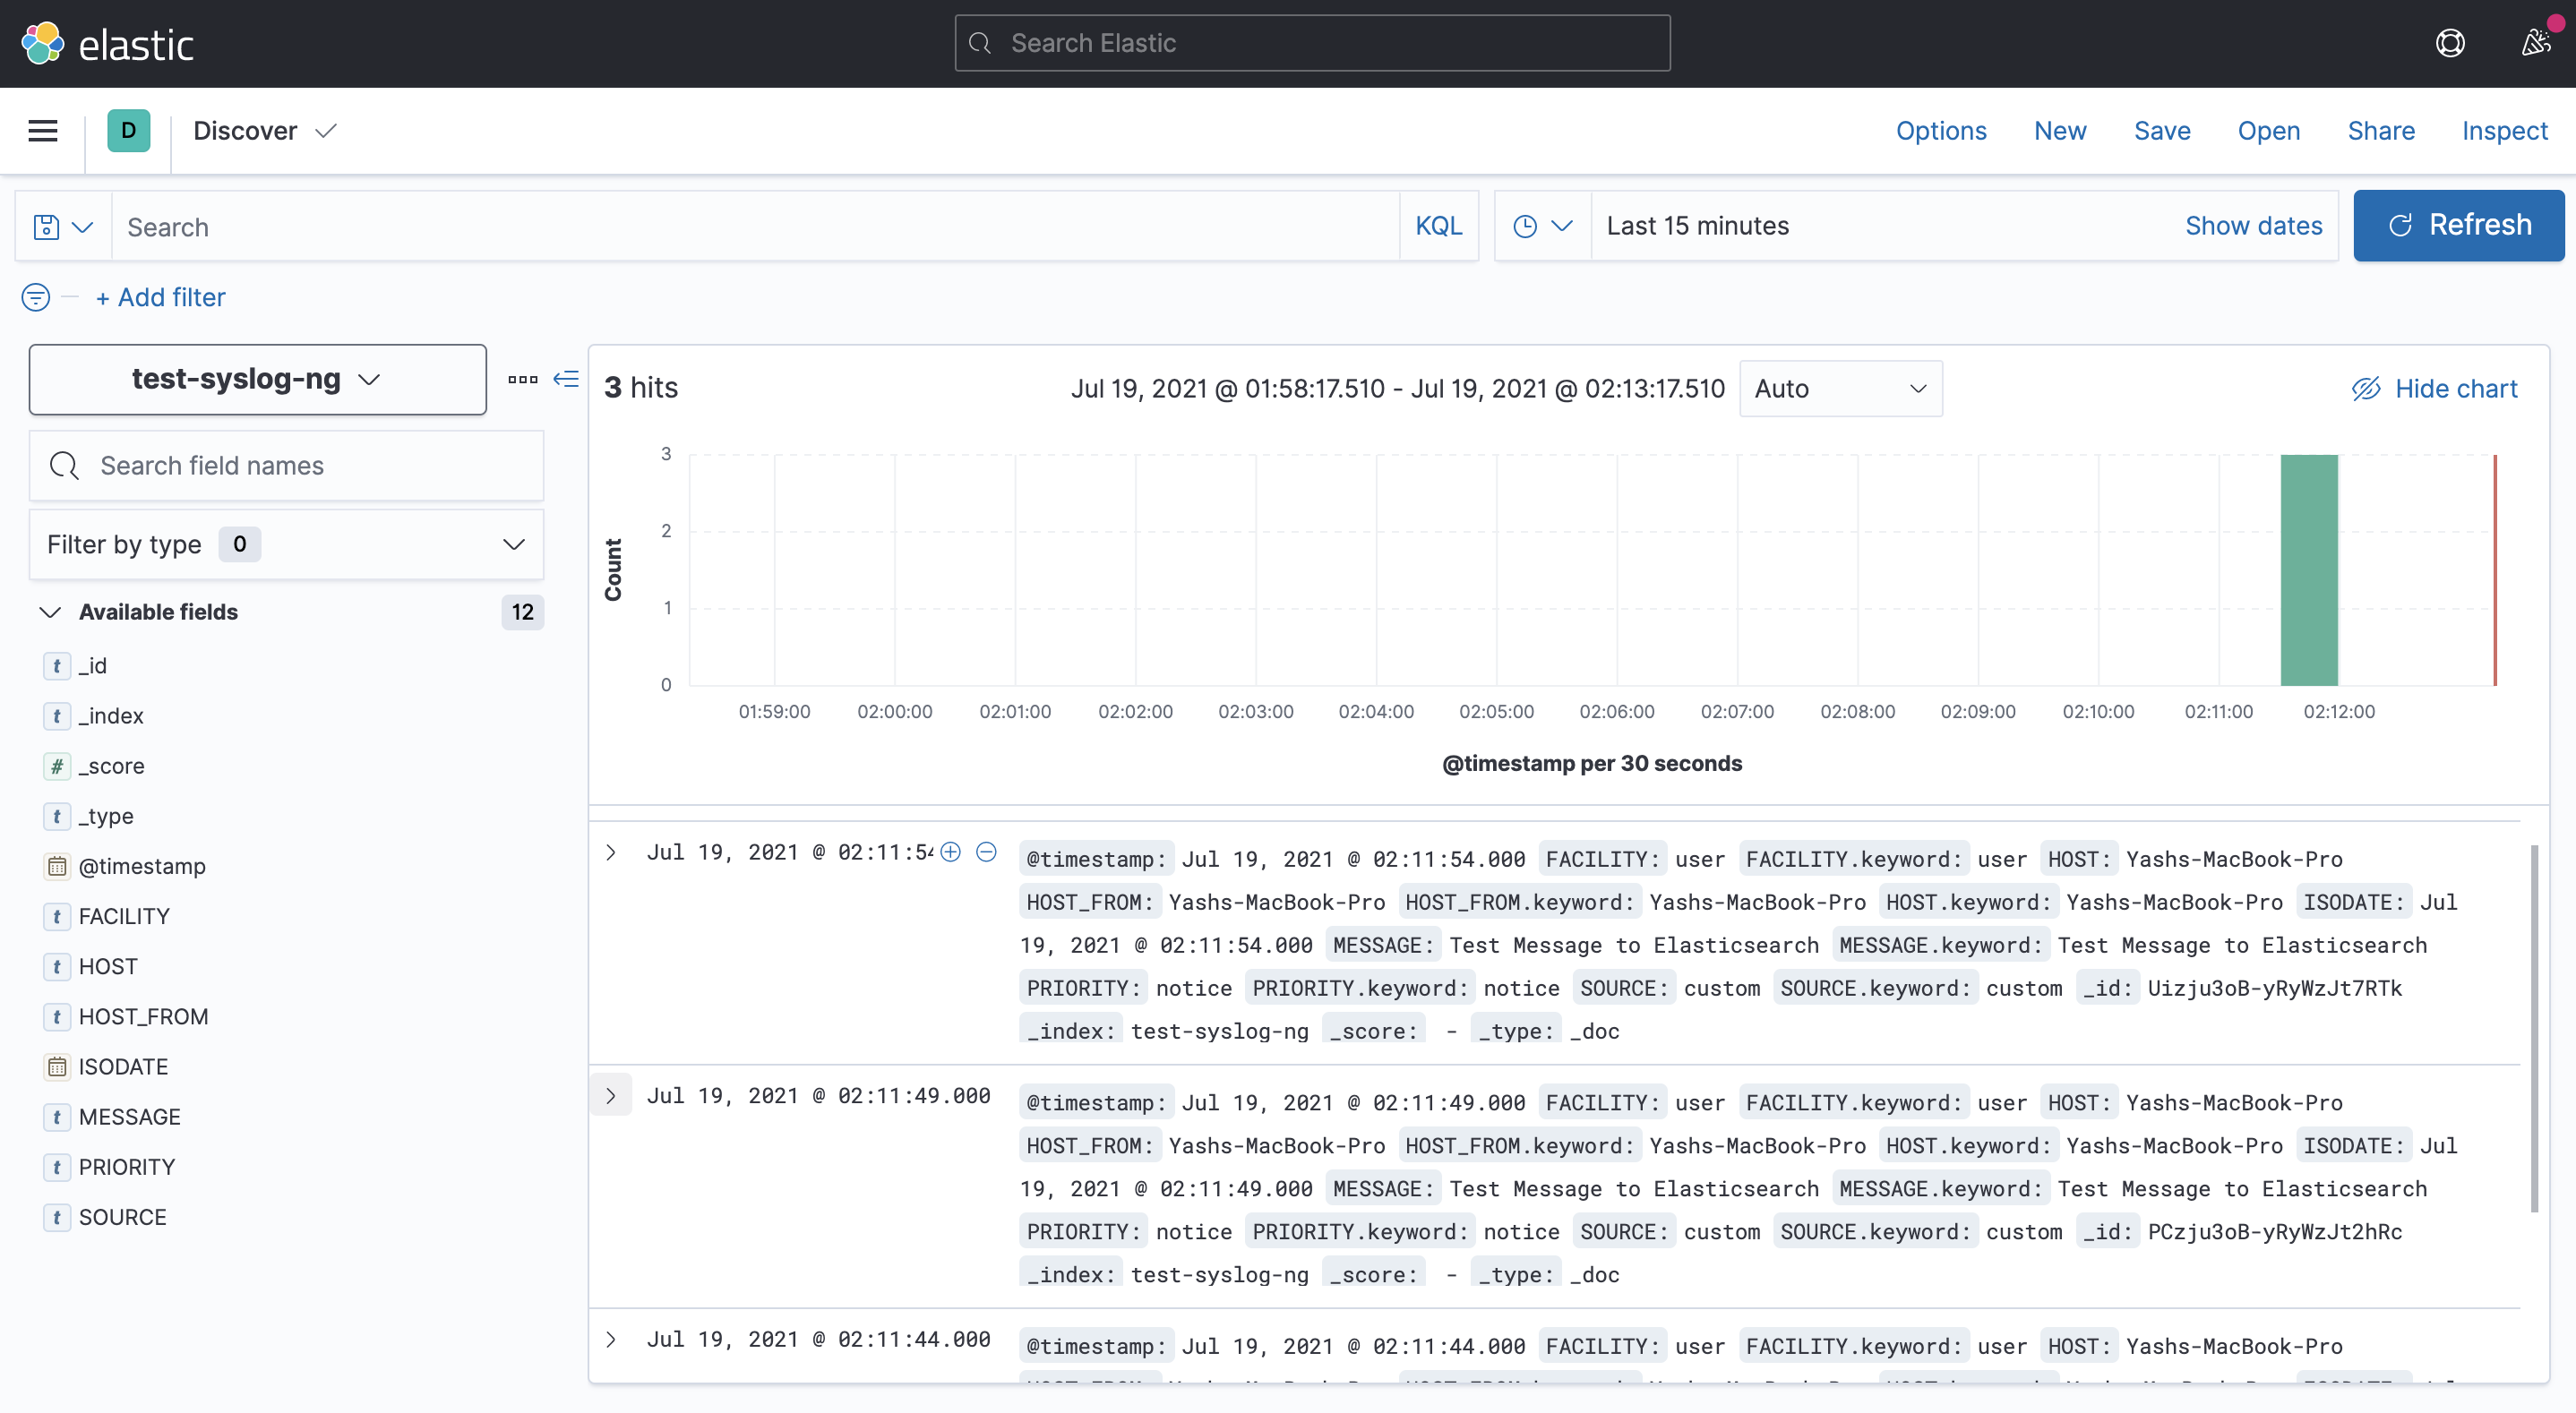
Now, create a new index with the same index as given in the configuration file, ie, test-syslog-ng and proceed to the next step of selecting the @timestamp field. Once this is done, we can see the incoming messages on the discover page. ( Menu -> Analytics -> Discover )
Here, you can select the index pattern you just defined and you should be able to see all the incoming messages.
Proof