Debugging
I suppose you have already cloned syslog-ng OSE into a local repository and you have all tools and libraries installed to compile syslog-ng.
Creating debug builds
You need to have debug symbols included in syslog-ng OSE in order to debug it “efficiently”. Step into your local clone and type the following commands:
$ ./autogen.sh
$ mkdir build
$ cd build
$ ../configure --enable-debug
$ make
$ sudo make install
The point is to pass the --enable-debug parameter to the configure script.
These commands will create a debug build under the build directory and
install syslog-ng OSE under a system specific directory. Installation will require
superuser privileges.
Installing and running without superuser privileges
You may need to test syslog-ng OSE without having superuser privileges. You can
install syslog-ng OSE into a custom location and run it without any privilege. This
solution is fine until you need to read from /dev/log or listen to ports
under 1024.
You can set the install location before the compilation process, just pass a
--prefix=<the path where syslog-ng OSE should be installed> parameter to the
configure script.
$ ./autogen.sh
$ mkdir build
$ cd build
$ ../configure --enable-debug --prefix=${HOME}/install/syslog-ng
$ make
$ make install
This way the make install command will not require superuser privileges and you can have
multiple versions from syslog-ng OSE on your computer.
Finding bugs
Unfortunately every software has bugs and syslog-ng OSE is not an exception. When you report the problem to the developers they might need some extra information to reproduce the issue in-house. In this section we introduce you to some frequently used tools which may greatly simplify the bug hunting.
Finding memory leaks
We suggest to use two tools to track down these problems. Valgrind can detect
memory leaks and many other things, it is available on a lot of operating
systems but it greatly slows down syslog-ng. heaptrack is very convenient to
use, it is faster than valgrind but it is not distributed as a binary package.
You also need a Linux with a decent C++11 compiler.
Installing valgrind
On most platforms you can use the native package manager to install valgrind.
On Ubuntu Trusty you need to execute the following command:
$ sudo apt-get install valgrind
On CentOS 7 just execute:
# yum install valgrind
Running syslog-ng OSE under valgrind
You can run syslog-ng OSE under valgrind with the following command.
G_SLICE=always-malloc valgrind --leak-check=full <the path where syslog-ng OSE is installed>/sbin/syslog-ng -F
You may use other parameters. The G_SLICE environment variable makes the
result nicer, because you will get less false positive results. The developers
are interested in valgrind’s output log.
Installing heaptrack
You will need a compiler with C++11 support. At least GCC 4.8 or clang 3.3 is required.
Ubuntu 14.04
In order to install heaptrack you have to compile it yourself. On Ubuntu Trusty the steps are the following:
apt-get update -y
apt-get install -y cmake \
                   g++ \
                   git \
                   libboost1.55-dev \
                   libboost-iostreams1.55-dev \
                   libboost-program-options1.55-dev \
                   libdwarf-dev \
                   libunwind8-dev \
                   software-properties-common

git clone git://anongit.kde.org/heaptrack.git /home/heaptrack
mkdir /home/heaptrack/build
cd /home/heaptrack/build
cmake -DCMAKE_BUILD_TYPE=RelWithDebInfo ..
make && make install
You may use other paths, not just /home/heaptrack.
CentOS 7
The steps are the following:
yum install -y epel-release
yum install -y cmake \
               gcc-c++ \
               git \
               boost-devel \
               boost-iostreams \
               boost-program-options \
               libdwarf-devel \
               libunwind-devel \
               make

git clone git://anongit.kde.org/heaptrack.git /home/heaptrack
mkdir /home/heaptrack/build
cd /home/heaptrack/build
cmake -DCMAKE_BUILD_TYPE=RelWithDebInfo ..
make && make install
You may use other paths, not just /home/heaptrack.
Running syslog-ng OSE with heaptrack
You can run syslog-ng OSE with heaptrack with the following command:
heaptrack <the path where syslog-ng OSE is installed>/sbin/syslog-ng -F
It will create a gzip file and after you stopped it, it prints something like this:
...
  heaptrack_print -l /home/milian/heaptrack.yourapp.12345.gz | less
The output of heaptrack_print provides you with a lot of information about memory
leaks. The Gzip file will be huge (some gigabytes or more) and heaptrack_print
will fully consume one of your CPUs when it runs. It is not as slow as valgrind
but you will notice the decreased performance.
You can generate nice and useful graphs with heaptrack. To do this, run pass the
-M option to it. The massif-visualizer program can parse the output file and
create diagrams like this:
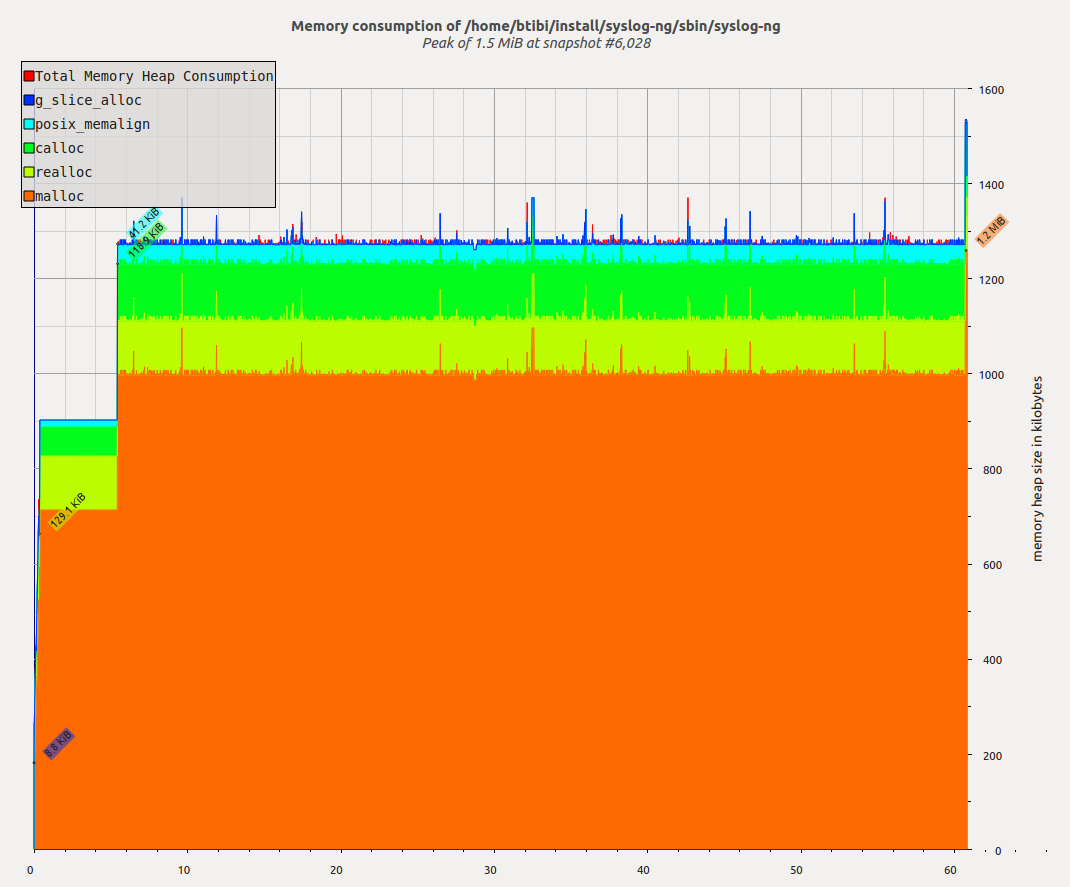
You can fine-tune the result with --massif-threshold and --massif-detailed-freq.
If you are interested in heaptrack, you can find more information here:
http://milianw.de/blog/heaptrack-a-heap-memory-profiler-for-linux